Graphical Visualization of statistical data: part2
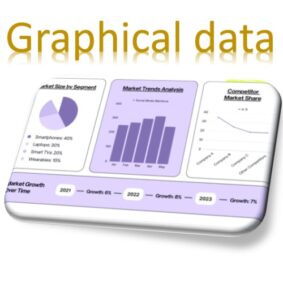
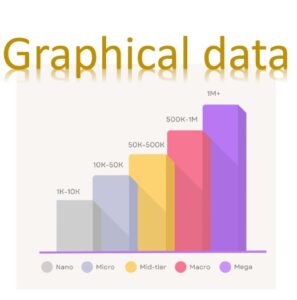
Graphical Visualization of statistical data Here are some key reasons why graphical visualization is necessary: Pattern Recognition: Communication and Interpretation: Storytelling and Persuasion: Identification of Relationships: Detection of Anomalies: Enhanced … Read more


