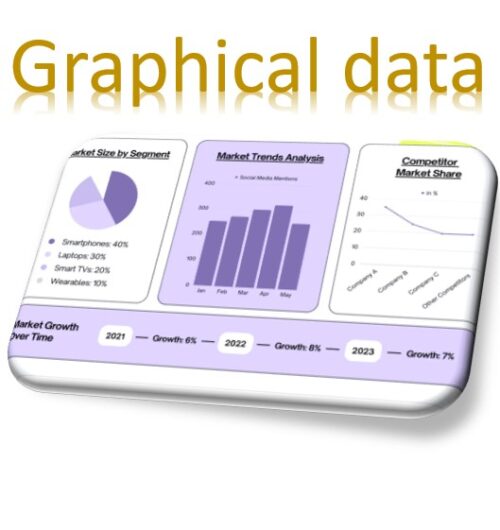
Graphical Visualization of statistical data
Here are some key reasons why graphical visualization is necessary:
- Pattern Recognition:
- Communication and Interpretation:
- Storytelling and Persuasion:
- Identification of Relationships:
- Detection of Anomalies:
- Enhanced Exploration and Discovery:
- Decision-Making Support:
- Increased Understanding
Graphical visualization complements traditional data analysis by providing a more accessible, interpretable, and communicative way to explore and understand complex datasets. It is a valuable tool for both analysts and decision-makers in gaining insights, making informed decisions, and effectively communicating findings to a broader audience.
Statistical analysis is a process of understanding how variables in a dataset relate to each other and how those relationships depend on other variables. Visualization can be a core component of this process because, when data are visualized properly, the human visual system can see trends and patterns that indicate a relationship. Here we will cover the chapter2, chapter3, chapter4 & chapter5.
Chapter2:
Contents
2. Categorical Data Ploting
- catplot()
- boxplot()
- stripplot()
- swarmplot()
- etc…
Chapter3:
3. Visualizing Distribution of the Data
- distplot()
- kdeplot()
- jointplot()
- rugplot()
Chapter4:
4. Linear Regression and Relationship
- regplot()
- lmplot()
Chapter5:
5. Controlling Ploted Figure Aesthetics
- figure styling
- axes styling
- color palettes
- etc..
Details of the topics are covered in details in the jupyter notebook embedded in this section, scroll through the notebook and study the codes.