
Contents
Pandas in Python
Pandas is a powerful and popular open-source data manipulation and analysis library for the Python programming language. It provides easy-to-use data structures and tools for efficiently working with structured data, such as tabular data (like spreadsheets or SQL tables), time series, and more. Pandas is widely used in data science, machine learning, and data analysis projects due to its flexibility, speed, and versatility.
Imagine you have a big table of information, like a spreadsheet. Pandas is like a magical tool that helps you play with this table easily. It’s as if you have a super-smart assistant for handling your data!
Here are some cool things Pandas can do:
-
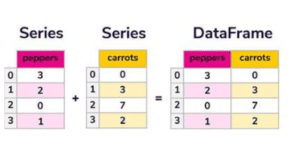
DataFrame and Series:
- Think of a DataFrame as a table. It has rows and columns, just like your spreadsheet.
- A Series is like a single column in that table. It holds data of the same kind, like ages or names.
-
Getting and Sorting Data:
- With Pandas, you can easily find specific rows or columns from your table.
- You can also sort your table based on certain columns.
-
Filtering and Searching:
- It’s like a search tool! You can tell Pandas to find things for you. For instance, show me people who are younger than 20.
- You can also ask it to find specific words or numbers.
-
Mixing and Matching Data:
- Imagine you have two tables. Pandas can help you combine them, like merging two puzzles together.
-
Making Data Neat:
- Sometimes, there are missing pieces in your table. Pandas can help you fix that.
- It can also help change the way data looks, so everything matches and is easier to understand.
- Pandas can talk to other smart tools like numbers and graphs, so you can make cool charts from your data.
Remember, Pandas is like your data friend. If you want to play with it, you just need to tell your computer to invite Pandas over by writing a special code. And that code looks a bit like instructions in a secret language!
To bring Pandas over to your computer, you just need to ask your computer to get it. You do that by typing pip install pandas in a special place called the terminal. Then, you’re all set to use Pandas and make your data work super easy and fun!
let us some an example for Data series which is 1-Dimensional
# importing pandas library
import pandas as pd
# Creating a list
author = ['Alex', 'Prajwal', 'Arnold', 'Johnson']
# Creating a Series by passing list
# variable to Series() function
author_series = pd.Series(author)
# Printing Series
print(author_series)
let us some example for Data Frame which is 2-Dimensional
# Importing Pandas library
import pandas as pd
# Creating two lists
author = ['Alex', 'Prajwal', 'Arnold', 'Johnson']
article = [210, 211, 114, 178]
# Creating two Series by passing lists
author_series = pd.Series(author)
article_series = pd.Series(article)
# Creating a dictionary by passing Series objects as values
frame = {'Author': author_series, 'Article': article_series}


# Creating DataFrame by passing Dictionary
result = pd.DataFrame(frame)
# Printing elements of Dataframe
print(result)
we will go through some python codes below:
Download the reference file for working from the github repository. click here: Titanic_csv file
The python code block is embedded here in the below section. please scroll through the embedded page to see the complete content. you can see the input command and output of the code for better understanding. practice these codes in your python.
The `titanic.csv` file is a commonly used dataset in data science and machine learning, particularly for demonstrating data analysis techniques and predictive modeling. The dataset contains information about the passengers on the Titanic, which sank after hitting an iceberg during its maiden voyage in 1912. This dataset is available from various sources, such as Kaggle, and contains several columns (or features) describing different attributes of each passenger.
Contents of the Titanic Dataset (`titanic.csv`)
Here is a general description of the typical columns you might find in a `titanic.csv` file:
- PassengerId: A unique identifier for each passenger in the dataset.
– Type: Integer
– Example: 1, 2, 3, etc.
- Survived: Indicates whether the passenger survived or not.
– Type: Integer (0 or 1)
– Values:
– `0` = Did not survive
– `1` = Survived
- Pclass: The passenger’s class on the ship.
– Type: Integer (1, 2, or 3)
– Values:
– `1` = First Class
– `2` = Second Class
– `3` = Third Class
- Name: The full name of the passenger.
– Type: String
– Example: “Braund, Mr. Owen Harris”
- Sex: The gender of the passenger.
– Type: String
– Values: `male`, `female`
- Age: The age of the passenger.
– Type: Float (can have missing values)
– Example: 22, 38, 26, etc.
– Note: Some passengers have missing age information, represented by `NaN`.
- SibSp: Number of siblings or spouses aboard the Titanic.
– Type: Integer
– Example: 0, 1, 2, etc.
- Parch: Number of parents or children aboard the Titanic.
– Type: Integer
– Example: 0, 1, 2, etc.
- Ticket: The ticket number of the passenger.
– Type: String
– Example: “A/5 21171”, “PC 17599”, etc.
- Fare: The ticket fare paid by the passenger.
– Type: Float
– Example: 7.25, 71.2833, etc.
- Cabin: The cabin number assigned to the passenger.
– Type: String (can have missing values)
– Example: “C85”, “B28”, etc.
– Note: Many entries are missing, as not all passengers had a cabin number.
- Embarked: The port where the passenger boarded the Titanic.
– Type: String
– Values:
– `C` = Cherbourg
– `Q` = Queenstown
– `S` = Southampton
– Note: Some entries may have missing values.
Additional Notes
– Missing Data: Some columns, such as `Age` and `Cabin`, contain missing values. Handling these missing values is often a key part of analyzing the dataset.
– Data Types: The dataset has a mix of data types, including numerical (`int`, `float`), categorical (`object`/`string`), and binary indicators (`0`/`1` for `Survived`).
– Target Variable: In predictive modeling, the `Survived` column is typically the target variable used to predict whether a passenger survived based on other features.
Usage
The `titanic.csv` file is widely used to practice data cleaning, feature engineering, and building machine learning models. It provides a real-world example of a classification problem where the goal is to predict a binary outcome (survival)
If you have worked on this file and familiarized the details. you are good to go for next lesson.
After completing these codes, go through the next lesson: data-manipulation
1 thought on “Introduction to Pandas in Python”