Pandas lesson2: Data Manipulation for datascience

Pandas lesson2: data manipulation provides you the second part of pandas learning tutorial dealing with data manipulations.

Imagine you’re a college student working with a lot of data—maybe it’s information about grades, students, courses, etc. Pandas is like a super handy toolkit that helps you organize and play around with this data in a computer-friendly way.

Data manipulation in pandas refers to the process of altering, transforming, and analyzing data using the Python library called pandas. Pandas is a popular data manipulation and analysis library that provides data structures and functions to effectively manipulate and process structured data, primarily in tabular form, similar to spreadsheets or databases. It’s widely used in data analysis and data science tasks.

Here are some common data manipulation tasks you can perform using pandas

1. Loading Data: You can use pandas to easily read data from files (like Excel sheets) and put them into neat tables called DataFrames. Think of these like supercharged spreadsheets.

2. Filtering and Selection : Want to see only the data that matches certain conditions? Pandas lets you do that. For instance, you can quickly find students who scored above a certain grade.

3. Data Cleanup : If your data is messy (missing values, weird formats), pandas has tools to clean it up so that it’s easier to work with. You wouldn’t want strange gaps or mistakes in your data, right?

4. Calculations : Let’s say you want to find the average grade in a course or the total number of students who took a particular class. Pandas helps you do math on your data without breaking a sweat.

5. Grouping : If you want to see how things are going across different classes or semesters, pandas can group your data and give you summaries. For example, you can see the average grades per course.

6. Sorting and Ranking : If you’re curious about who got the highest grades, you can sort your data by grades. And if you want to see who’s doing really well, you can give ranks based on their scores.

7. Combining Data : Imagine you have one list of students and another with course info. Pandas can help you put these together so you can see who’s taking what class.

8. Making Sense of Data : If you want to visualize your data as graphs or charts, pandas can team up with other tools to help you make cool visuals.

9. Playing with Data : You can do all sorts of things with pandas, like transforming your data into different shapes, trying out different ideas, and seeing what makes sense.

Basically, pandas is like a friendly data butler for you. It takes your messy, confusing data and helps you turn it into useful information that you can understand and work with.

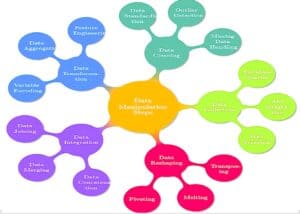
Data manipulation in connections with different terms is shown in the schematic diagram below.

Data Manipulation
Data Manipulation Map


Data Manipulation for Datascience

How Data science uses various data manipulation techniques is described here:

Data manipulation in data science involves transforming, cleaning, and organizing data to make it suitable for analysis. This process is critical because raw data is often messy, incomplete, or unstructured, and it must be prepared and shaped to allow meaningful analysis and visualization. Data manipulation typically involves a series of steps, each of which serves a specific purpose in preparing the data.

Key Steps in Data Manipulation for Data Science

  1. Data Cleaning:

– Handling Missing Values: Dealing with missing data by methods such as imputation (replacing missing values with the mean, median, mode, or a more complex statistical estimate) or removing rows/columns that contain missing values.

– Removing Duplicates: Identifying and removing duplicate entries that can distort analysis.

– Correcting Errors: Fixing data entry errors, inconsistencies, or typos to ensure data quality (e.g., correcting spelling errors, standardizing units, etc.).

– Handling Outliers: Identifying and managing outliers that may skew analysis results, which can involve removing them or using more robust statistical techniques.


  1. Data Transformation:

– Scaling and Normalization: Adjusting the scale of variables so that they can be compared or combined meaningfully, such as normalizing to a range (e.g., 0 to 1) or standardizing to have a mean of 0 and standard deviation of 1.

– Encoding Categorical Variables: Converting categorical data (e.g., gender, country) into a numerical format suitable for machine learning models, using techniques like one-hot encoding or label encoding.

– Aggregating Data: Summarizing or aggregating data, such as computing sums, averages, or other statistics, to reduce data dimensionality or focus on relevant metrics.

– Feature Engineering: Creating new features from existing data that better capture the underlying patterns or relationships in the data. This can involve mathematical transformations, combining multiple features, or applying domain-specific knowledge.


  1. Data Integration:

– Merging and Joining Datasets: Combining data from different sources or tables to create a unified dataset, which is essential when dealing with multiple data sources.

– Concatenation: Stacking datasets on top of each other, either horizontally or vertically, to extend data.

– Reshaping Data: Changing the structure or format of the data to make it more useful or compatible with a particular analysis method, like pivoting or melting data in a table format.


  1. Data Reduction:

– Dimensionality Reduction: Reducing the number of features or dimensions in a dataset while retaining as much variance or information as possible, using techniques like Principal Component Analysis (PCA) or Feature Selection methods.

– Sampling: Reducing the dataset size by selecting a representative subset, which can make analysis faster and more feasible, especially with large datasets.


  1. Data Visualization:

– Exploratory Data Analysis (EDA): Creating visualizations (e.g., histograms, scatter plots, box plots) to understand the distribution, trends, relationships, and anomalies in data.

– Data Summarization: Using descriptive statistics (mean, median, mode, standard deviation) to summarize data and understand its characteristics.


  1. Data Validation and Verification:

– Consistency Checks: Ensuring the data is logically consistent (e.g., age should not be negative).

– Cross-Validation: Checking data across multiple sources or methods to verify its accuracy and consistency.

Common Tools and Libraries for Data Manipulation


– Python: Libraries like Pandas, NumPy, and Scikit-learn are popular for data manipulation and analysis.

– R: dplyr, tidyr, and data.table are commonly used for similar tasks in the R programming language.

– SQL: Used for querying and manipulating data stored in relational databases.

– Excel: Widely used for basic data manipulation, especially in smaller datasets.


 Importance of Data Manipulation in Data Science


– Enhances Data Quality: Ensures that the data is accurate, complete, and reliable.

– Improves Model Performance: Properly prepared and well-structured data leads to better performance in machine learning models.

– Enables Effective Analysis: Helps uncover patterns, correlations, and insights that would be difficult or impossible to detect in raw, unorganized data.

– Reduces Computational Complexity: By reducing data size and eliminating irrelevant information, data manipulation helps in faster computation and analysis.

Data manipulation is a critical step in the data science workflow that lays the foundation for meaningful analysis and decision-making.

The python code block is embedded here in the below section. please scroll through the jupyter notebook embedded page to see the complete content and practice it in google colab notebook.

After completing these exercises, the next lesson to study is : file-read-and-write-operations

Was this article helpful?
YesNo

1 thought on “Pandas lesson2: Data Manipulation for datascience”

Leave a Comment